Claude for Excel & PowerPoint: Shared Context Workflows
Claude

Pas sûr de quoi faire ensuite avec l'IA?Évaluez la préparation, les risques et les priorités en moins d'une heure.
➔ Téléchargez notre kit de préparation à l'IA gratuit
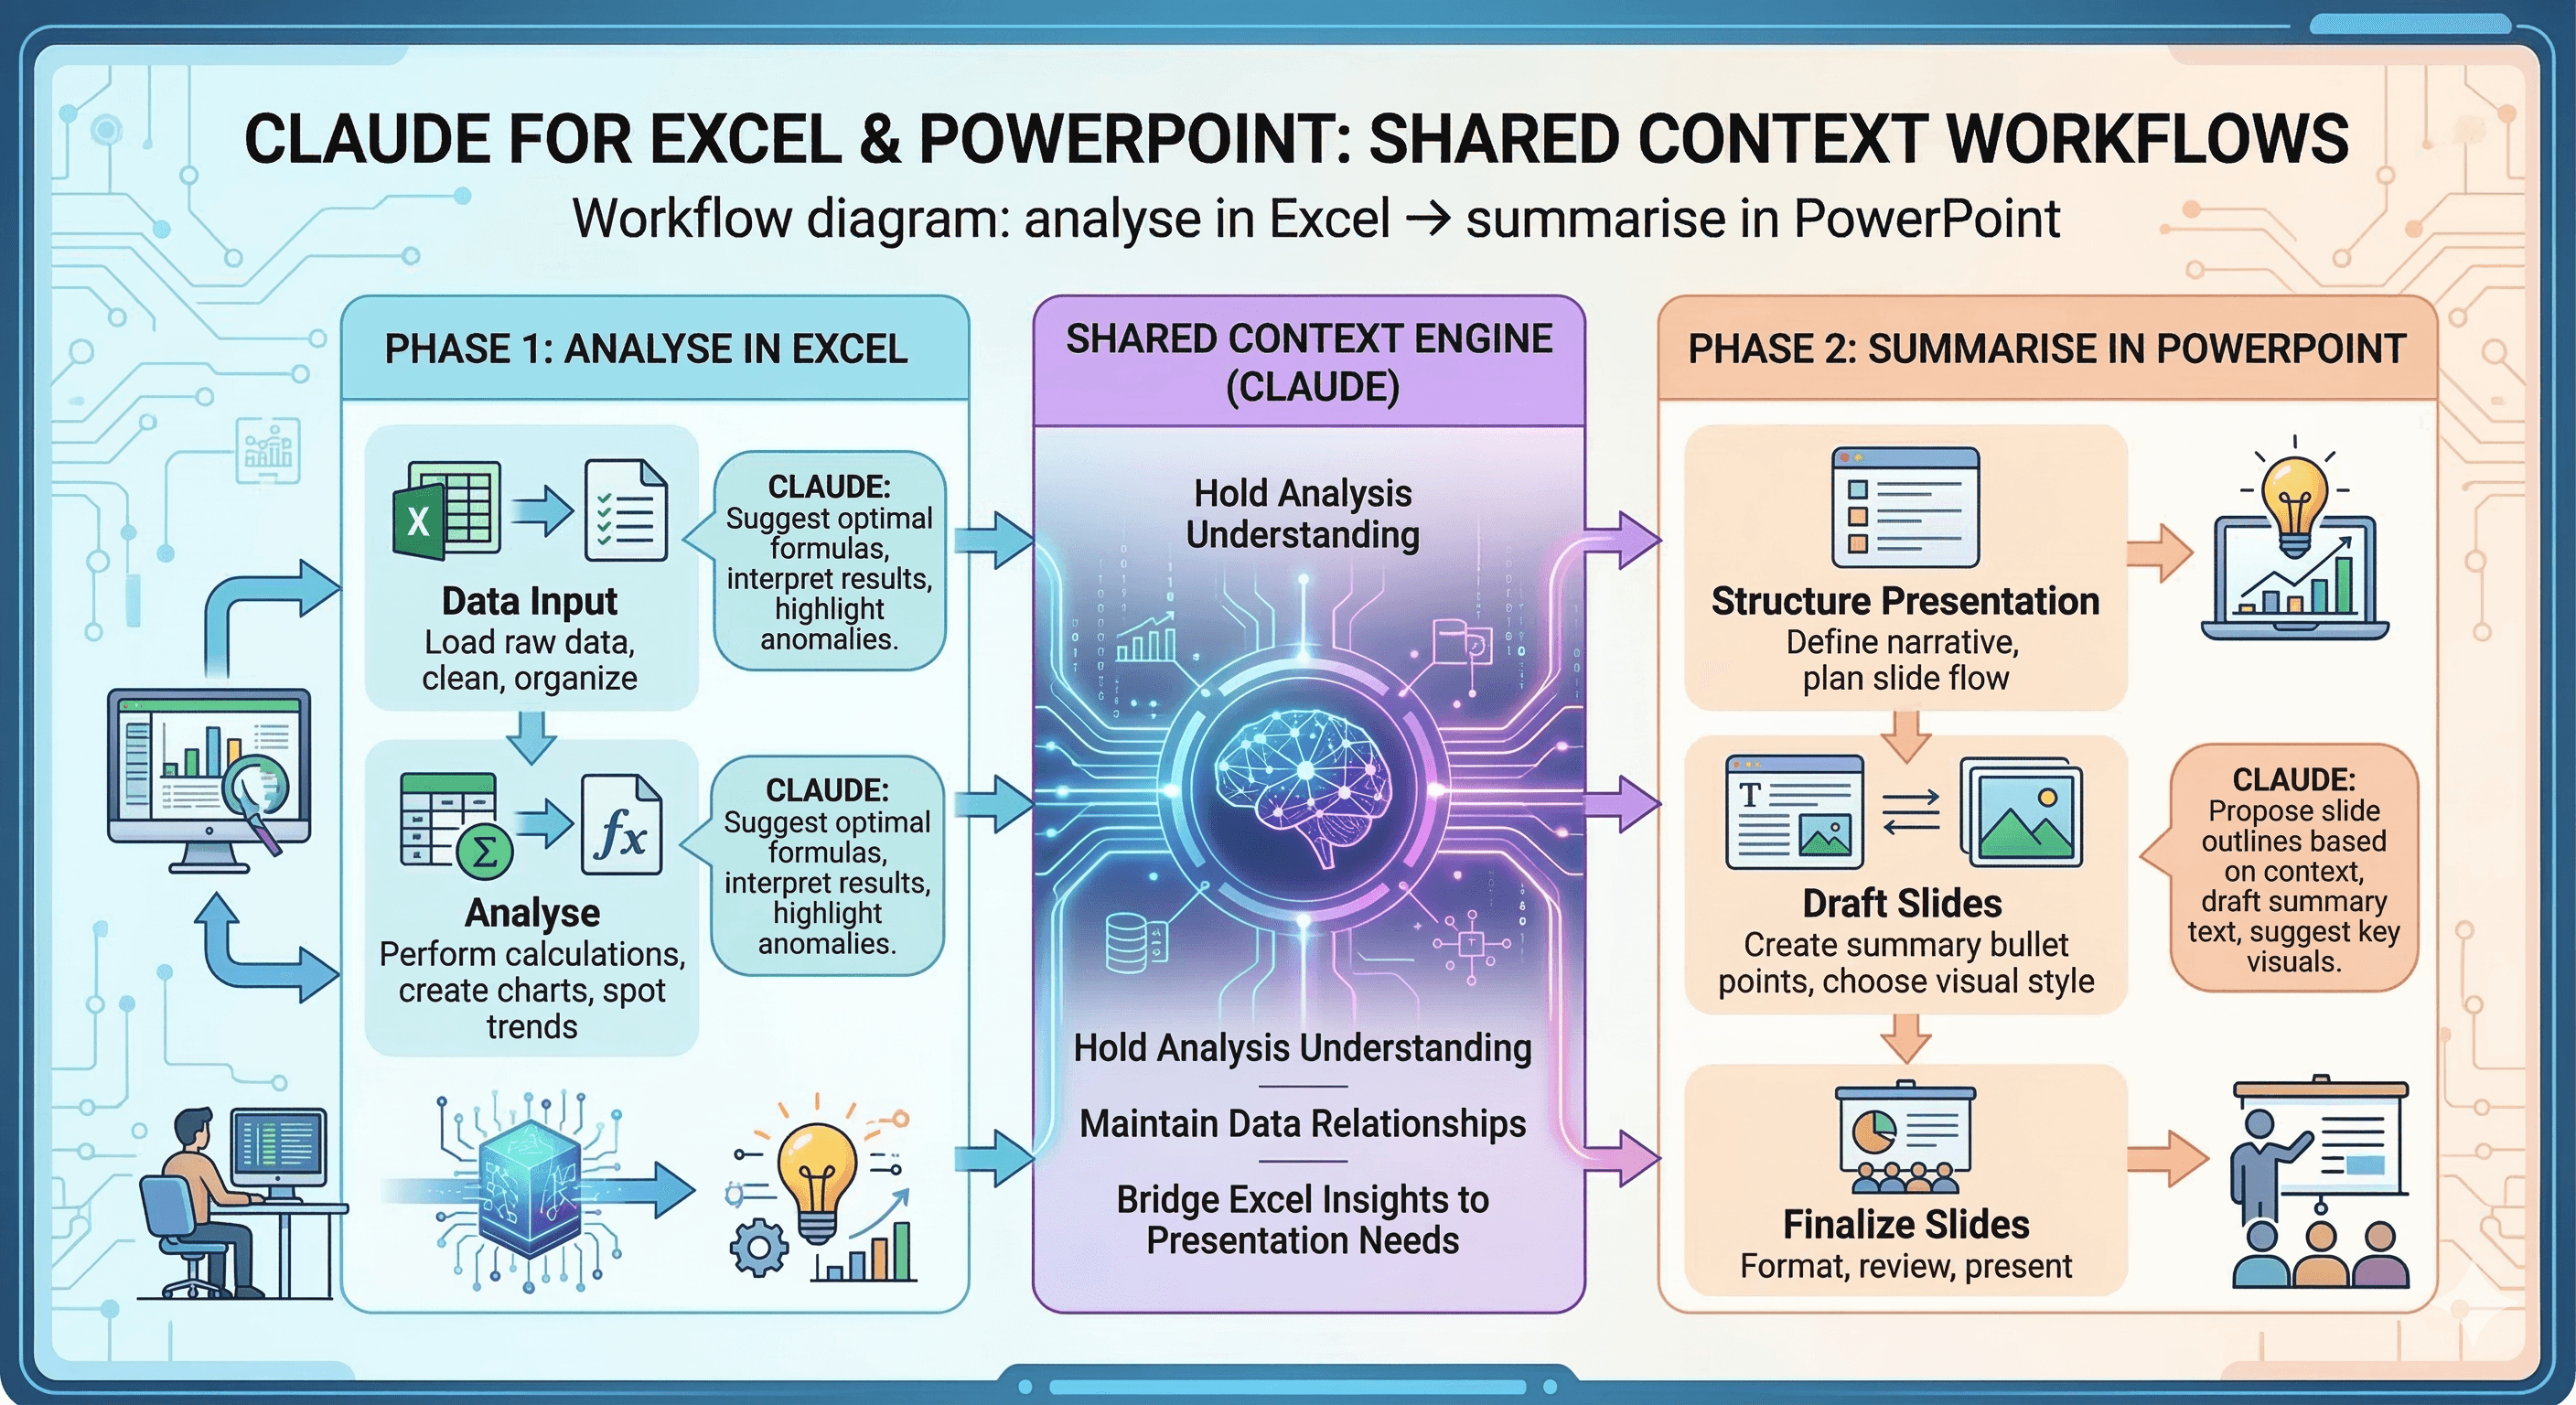
Claude for Excel and PowerPoint lets you run a single workflow across both apps by sharing context between open files. You can analyse a workbook in Excel, then have Claude create or update a PowerPoint deck using the same figures—without re‑explaining your data or copying and pasting charts and tables.
Spreadsheets are where decisions get made. Slide decks are where those decisions get communicated. The problem is the space between them: copying numbers, rebuilding charts, rewriting the same narrative, and losing track of which version is “the latest”.
Claude’s Excel and PowerPoint add‑ins now reduce that friction by sharing context across open files, so you can move from analysis to storytelling in one continuous workflow.
This guide explains what the feature does, how to switch it on, and how to use it for repeatable workflows your team can run every week.
What’s new: shared context across open files
When you have the Claude add‑ins active in Excel and PowerPoint, Claude can carry the relevant context of your conversation between the apps. In practice, that means you can:
Ask Claude to analyse an Excel workbook (for example, a monthly performance model).
Then ask Claude to create or update a PowerPoint deck using those same outputs.
Keep the conversation going without re‑explaining the spreadsheet structure, key tabs, or outputs.
The outcome isn’t just speed. It’s consistency: the same logic, the same story, the same formatting expectations—run again and again.
How it works (and what it can access)
Claude coordinates behind the scenes using the Excel and PowerPoint add‑ins. It can read from and write to files that are currently open in either app.
A few practical implications:
Claude can pull numbers from an open workbook into a slide, update a chart, or populate a spreadsheet from a deck.
Claude can’t open or switch files for you; the files must already be open.
Cross‑app chat history is not saved between sessions, so treat each session as a focused workflow.
Requirements and setup
To use cross‑app workflows:
Install the add‑ins
Get the Claude add‑ins for Excel and PowerPoint from Microsoft Marketplace/AppSource.
Activate each add‑in at least once
Open Excel and PowerPoint and run the add‑ins so they’re properly connected.
Turn on “Let Claude work across files”
In each add‑in’s settings, toggle the cross‑file/cross‑app option on.
Team and Enterprise note: cross‑file working may be off by default for organisational plans, depending on admin settings.
Practical workflows you can run today
Below are four workflows that map to common business outcomes. Each one is designed to be repeatable.
1) Monthly performance pack (Finance / FP&A)
Goal: turn a close pack workbook into an exec-ready narrative deck.
Workflow
In Excel: ask Claude to identify the key drivers (revenue, margin, opex), highlight variances vs budget, and call out any anomalies that need investigation.
Ask Claude to produce a short “so what?” summary for leadership: what changed, why it matters, and what needs a decision.
In PowerPoint: ask Claude to create a 6–8 slide pack with a consistent structure:
headline results, 2) revenue bridge, 3) margin drivers, 4) cost drivers, 5) risks, 6) actions/decisions.
What makes it repeatable
You can reuse the same prompt pattern each month.
You can pair it with Skills (see below) to enforce modelling conventions and slide standards.
2) Sales QBR deck from pipeline data (Revenue teams)
Goal: build a Quarterly Business Review deck without rebuilding charts by hand.
Workflow
In Excel: ask Claude to summarise pipeline coverage, stage conversion, and forecast risk.
Ask Claude to list the top 10 deals driving forecast movement and flag where the data is incomplete.
In PowerPoint: ask Claude to update your existing QBR template with the latest figures and a short narrative per segment.
What to watch
If your workbook has multiple tabs with different definitions, be explicit about which tab is the “source of truth”.
3) Ops dashboard → leadership story (Operations)
Goal: translate operational metrics into decisions, not just charts.
Workflow
In Excel: ask Claude to explain which operational metrics changed materially and which are noise.
Ask for 3–5 recommended actions tied to the data (for example, staffing, supplier changes, SLA adjustments).
In PowerPoint: ask Claude to draft a decision-ready slide: recommendation, expected impact, assumptions, and next steps.
4) Investor-style slides from a model (Strategy)
Goal: turn a scenario model into a clean strategic narrative.
Workflow
In Excel: ask Claude to compare scenarios and surface the key sensitivities.
In PowerPoint: ask Claude to create a succinct “base / bull / bear” set of slides and keep the narrative consistent with your assumptions.
Use Skills to make workflows consistent
The biggest unlock isn’t just moving between apps—it’s making the workflow dependable.
Skills let you bake in standards. For example:
An “Excel modelling conventions” Skill (input colours, assumptions tab structure, naming conventions).
A “Slide writing style” Skill (tone, slide titles, how you express numbers, preferred chart styles).
When cross‑app work is enabled, Claude can apply the relevant Skills in the right place—so your spreadsheet stays structured and your deck stays on-brand.
If you’re trying to build repeatable workflows across teams, this matters more than any single prompt.
Common pitfalls (and how to avoid them)
Pitfall 1: Claude is working from the wrong tab or version
Fix: tell Claude the exact tab name and the output cells/ranges that represent the final numbers.
Pitfall 2: The deck looks “AI‑generated”
Fix: provide a template deck and specify the slide structure you want (titles, chart positions, narrative length). Skills help here.
Pitfall 3: Confusion about what Claude can access
Fix: remember the scope is open files only. If a file isn’t open, Claude can’t read it.
Pitfall 4: Governance blind spots
Fix: treat this like any other new workflow tool. Decide what data can be used, who can install add‑ins, and what “good” looks like. If you’re in a regulated environment, align with your internal data handling policy.
Governance and admin considerations
For many organisations, the question isn’t “can it do it?”—it’s “can we deploy it responsibly?”
A simple checklist:
Access control: decide whether the add‑ins should be available to everyone or a pilot group.
Data handling: understand what’s retained and for how long, and whether add‑in activity appears in your normal audit tooling.
Workflow standards: define a baseline pack (for example, monthly reporting) and a Skill that keeps outputs consistent.
If you need help, this is exactly the kind of practical governance work Generation Digital supports: making AI useful without creating shadow processes.
Summary
Claude’s shared context across Excel and PowerPoint is a practical step towards “work that carries forward”: analysis becomes narrative without the usual handovers.
If you want to pilot this responsibly—or build repeatable workflows your team can trust—Generation Digital can help you design the workflow, the Skills, and the governance to scale it.
Next steps: speak with our specialists about AI powered workflows and collaboration: https://www.gend.co/contact
FAQs
1) Can Claude pull figures from Excel directly into my PowerPoint deck?
Yes—if the workbook and deck are both open and cross‑app working is enabled, Claude can read the Excel file and update PowerPoint slides with the relevant numbers, tables, or charts.
2) Do I need to re‑explain the spreadsheet every time I switch apps?
No. Claude carries context across the open files during the workflow, so it can keep track of the model structure and outputs while building or updating slides.
3) What are the limitations today?
Claude can only work with files that are currently open. It can’t open, close, or switch files for you from the add‑ins, and cross‑app chat history isn’t saved between sessions.
4) Can admins restrict access to the add‑ins?
Yes. Team and Enterprise owners can manage whether users can access Office add‑ins via Microsoft 365 admin controls.
5) How do we make outputs consistent across the team?
Use Skills to encode your standards (modelling conventions, slide templates, tone of voice) and pair them with a repeatable workflow prompt.
Recevez chaque semaine des nouvelles et des conseils sur l'IA directement dans votre boîte de réception
En vous abonnant, vous consentez à ce que Génération Numérique stocke et traite vos informations conformément à notre politique de confidentialité. Vous pouvez lire la politique complète sur gend.co/privacy.


Génération
Numérique

Bureau du Royaume-Uni
Génération Numérique Ltée
33 rue Queen,
Londres
EC4R 1AP
Royaume-Uni
Bureau au Canada
Génération Numérique Amériques Inc
181 rue Bay, Suite 1800
Toronto, ON, M5J 2T9
Canada
Bureau aux États-Unis
Generation Digital Americas Inc
77 Sands St,
Brooklyn, NY 11201,
États-Unis
Bureau de l'UE
Génération de logiciels numériques
Bâtiment Elgee
Dundalk
A91 X2R3
Irlande
Bureau du Moyen-Orient
6994 Alsharq 3890,
An Narjis,
Riyad 13343,
Arabie Saoudite


Numéro d'entreprise : 256 9431 77 | Droits d'auteur 2026 | Conditions générales | Politique de confidentialité