What is a Gantt Chart?
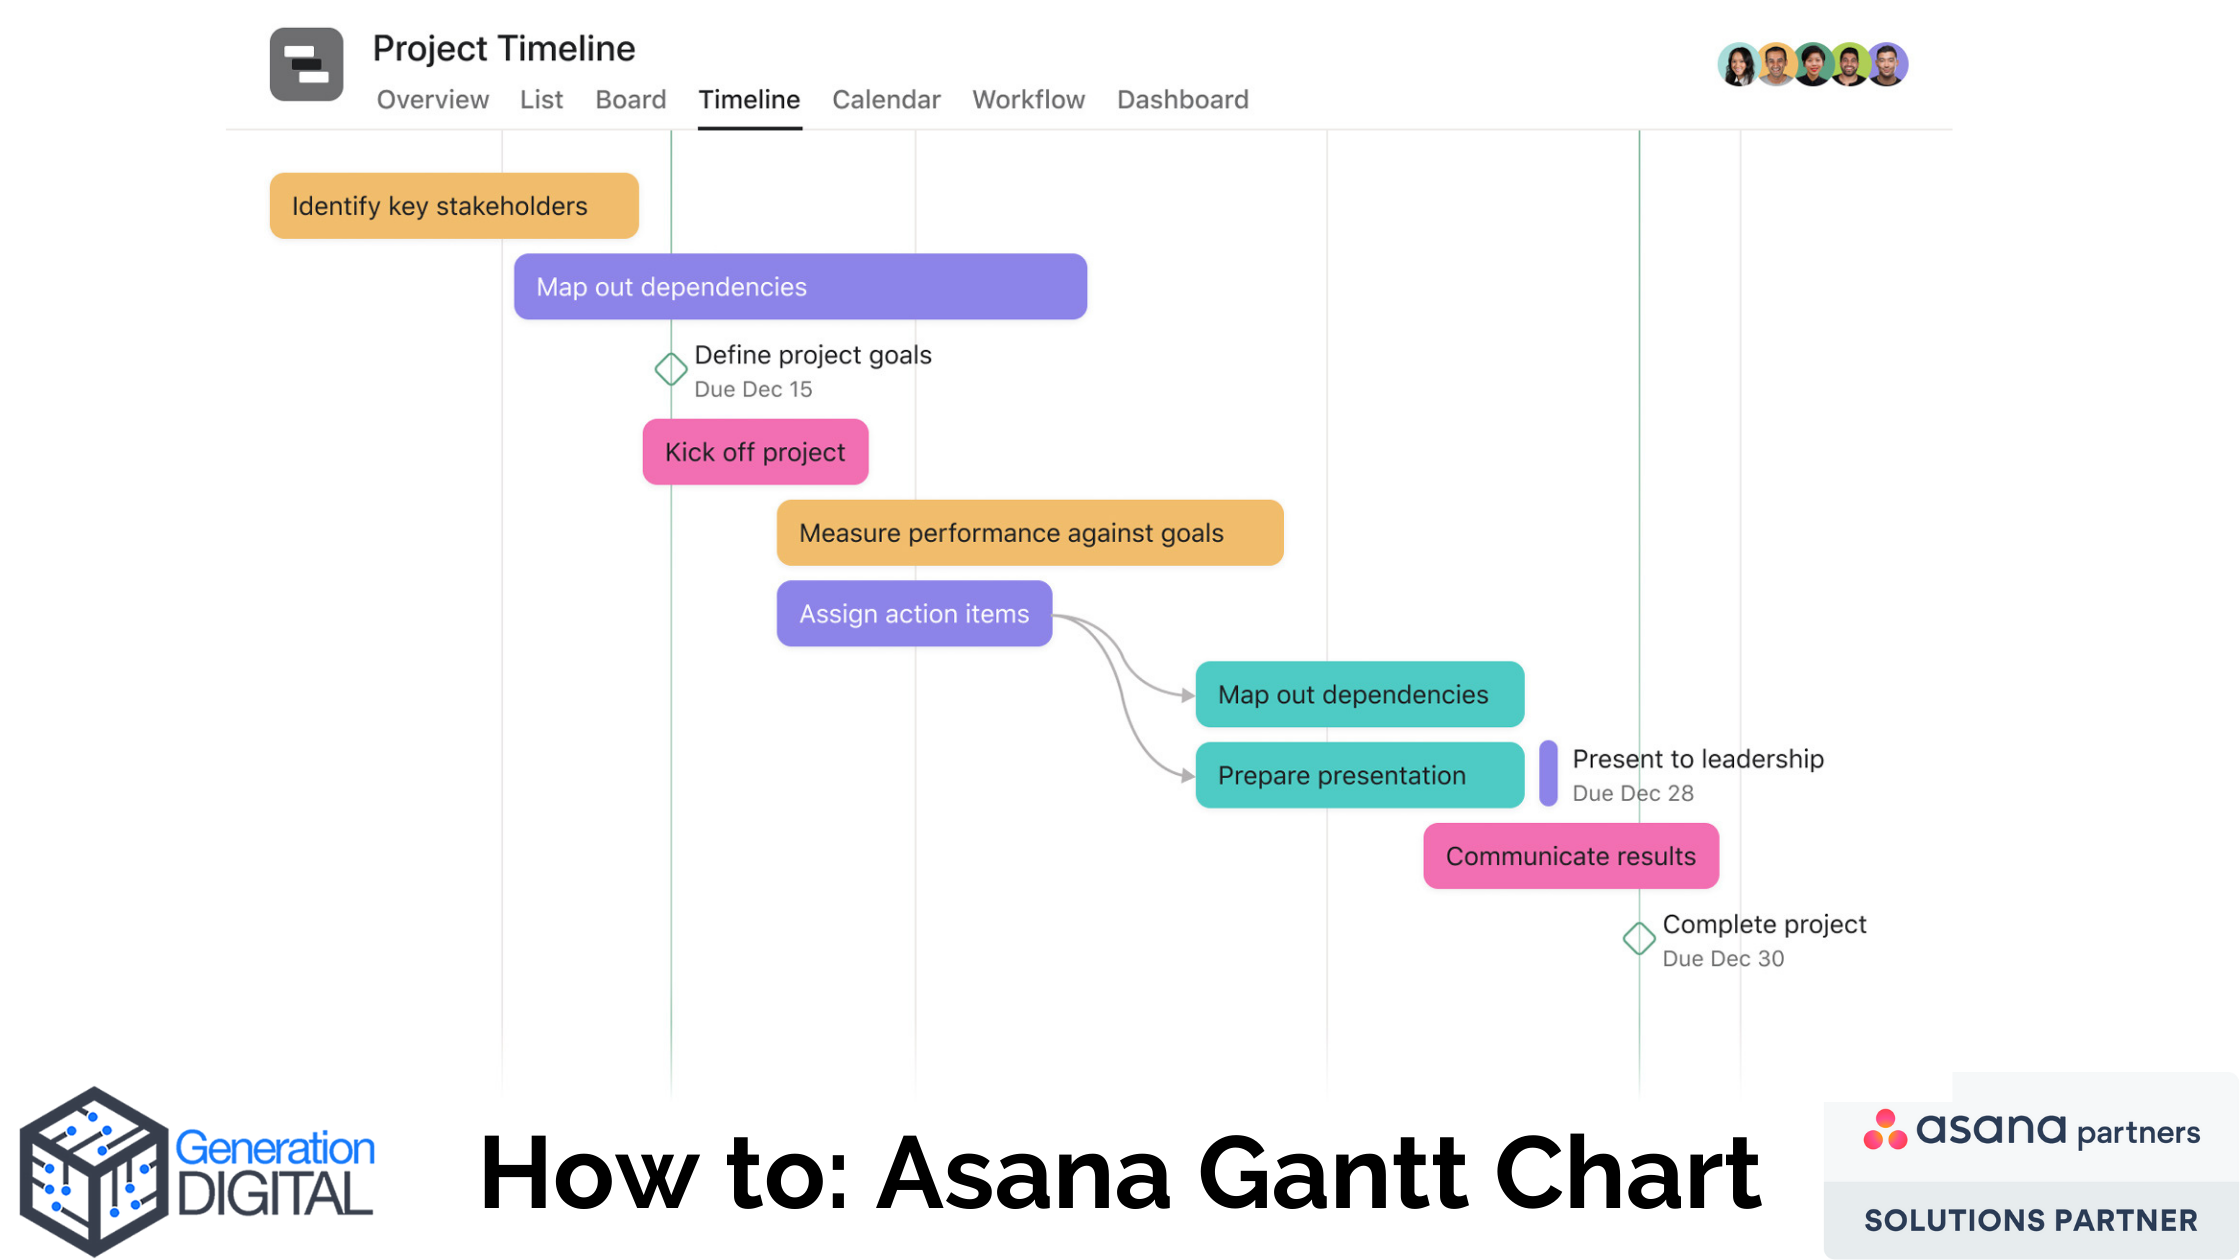
Gantt charts are often used in business to provide an overview of a project and illustrate the timelines. Horizontal bars relate to tasks, and the length of that bar corresponds to the time that task will take to complete. Gantt charts, as well as dates and durations, usually also show milestones and task owners.
Gantt charts follow a critical path approach, which shows where there is a delay caused by a single task in the Timeline. This helps determine which tasks you need to complete for a successful project without missed deadlines. Many deadline-driven project types can use the Gantt chart style, but the three most common are Marketing Campaign Maps, Outlining Deliverables and Product Launches.
Firstly, there are some things you have to clarify:
- The start and end date of the project itself
- Clarify the tasks making up the project and their due/start/end dates
- Make a note of any dependencies between the tasks (a particular task that cannot be started without a previous one being completed)
- Markdown milestones- these could be after significant deliverables or marking checkpoints
- Be ready to adapt and move the Gantt Chart as the project progresses
When this is complete, it is time to set up the project. Start with a blank project under the team that this Gantt chart will belong to. Asana recommends using Timeline as the view for deadline-driven projects as this will display the project in a Gantt format. Then it is time to add your tasks and milestones to the project with their due/start/end dates and assignees.
Milestone will show as green diamonds on the Gantt chart with a vertical line running across the Timeline. If the tasks added are large 'To Do's that may have smaller action items making them up, you can add subtasks. This means you can then delegate the smaller portions of the task to other members of the team or review parts of this task without affecting the Gantt chart style.
After all the tasks are added to the project, you can then add your dependencies. These are shown as a visual line between tasks and indicate if a task is blocking or is blocked by the completion of another. This helps identify bottlenecks within a project and assists the visual flow of the Gantt chart.
Overall, Asana's Timeline lends itself to the Gantt view, and it can be helpful for stakeholder overviews, keeping projects on track and reducing confusion.