Quickly Create Pie Charts in Miro for Fast Visuals (2026)
Miro
Free AI at Work Playbook for managers using ChatGPT, Claude and Gemini.
➔ Download the Playbook
Miro lets you build pie charts in minutes using the Charts tool or a Pie Chart template. Enter positive values (Miro calculates the shares), tidy titles/legends, then present or export as JPG/PDF—all without leaving your board. Colours are auto-assigned for speed and consistency.
Why this matters
When stakeholders skim, visuals win. Miro’s Charts let you add a pie chart straight from the toolbar, edit the data inline, and present or export without leaving the board—ideal for quick proportion breakdowns in planning decks and status reviews.
Two quick ways to create a pie chart
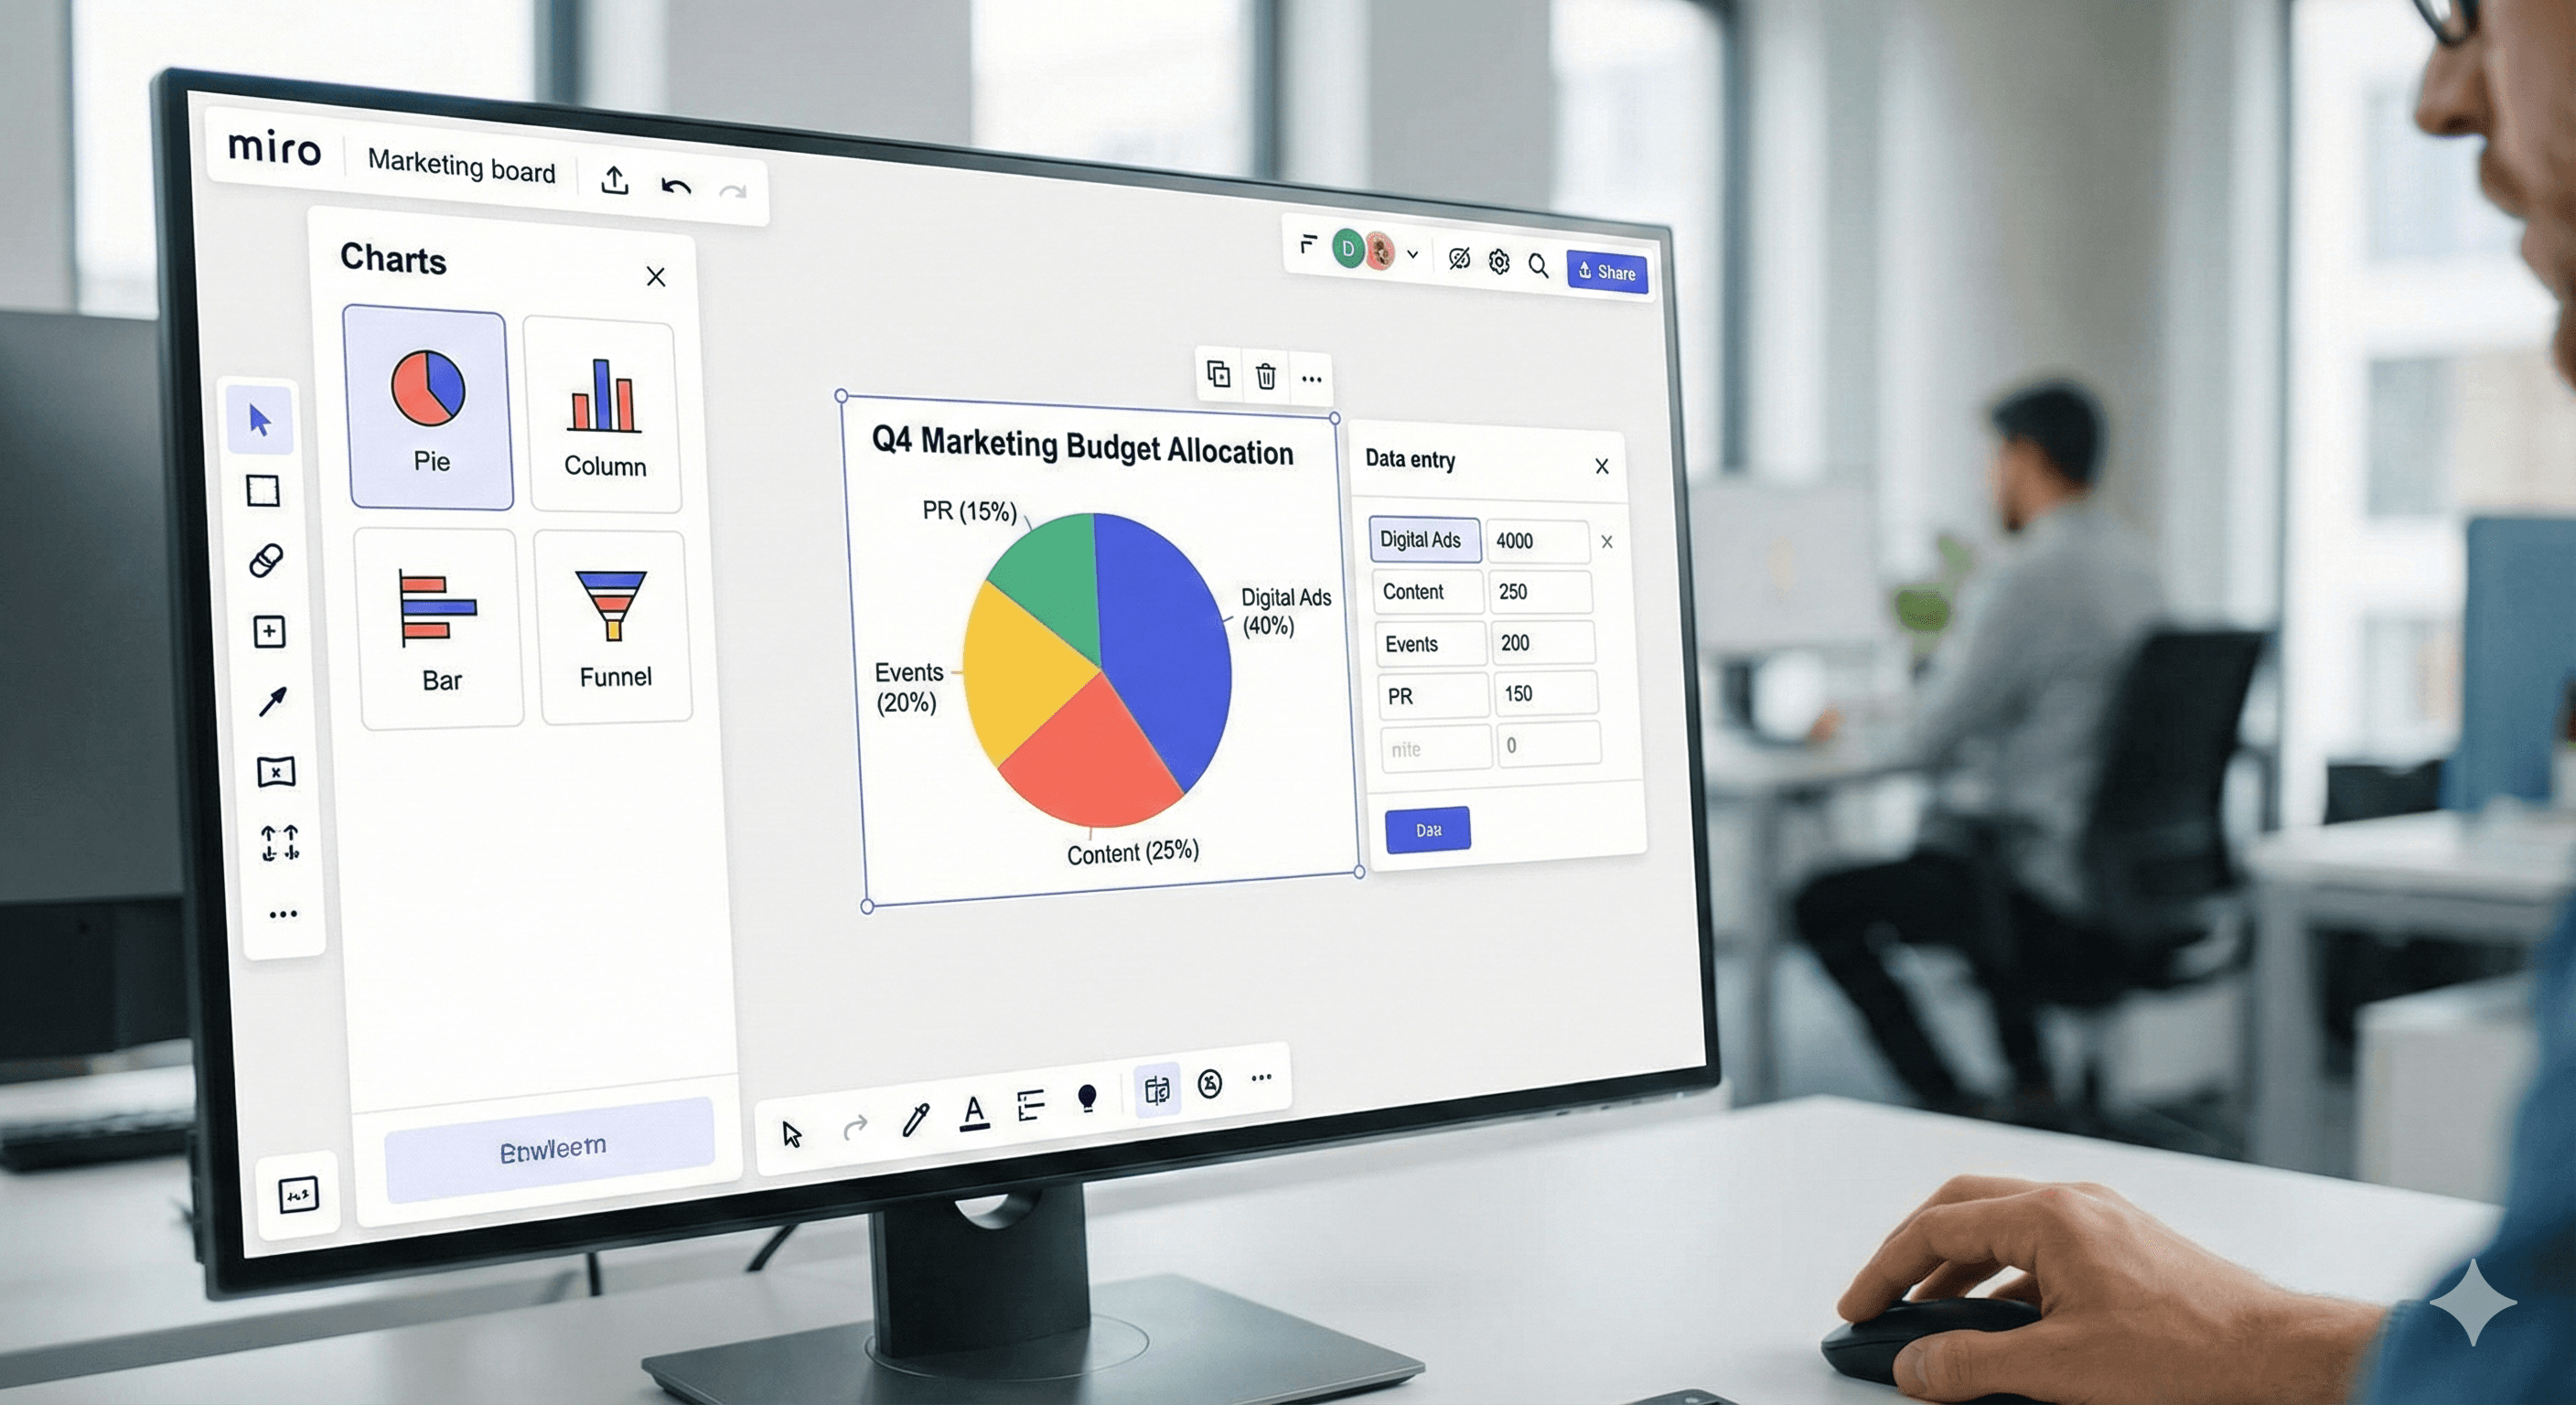
1) From the Charts tool (fastest)
Open your board → Charts (left toolbar) → choose Pie.
Double-click the chart to edit; type your values (positive numbers only).
Toggle Title/Legend to tidy up.
Present on the board or export as JPG/PDF (see below).
Notes: Miro auto-selects colours for chart segments (manual colour picking isn’t supported); charts accept positive numbers only.
2) Use the Pie Chart template
Templates → Pie Chart, then Use template.
Double-click the chart and enter real numbers (not percentages)—Miro calculates the shares.
Edit title/legend; keep styling consistent with your board.
Collaboration & export
Invite teammates to co-edit in real time and gather comments on the board.
Export frames/boards as JPG or PDF, or CSV (text objects) if you need to move content elsewhere. Export options vary by plan and are controlled by board owners.
When to use a pie (and when not to)
Use pies for parts-of-a-whole that sum to 100% (e.g., budget allocation).
Prefer bars/lines for small differences or time trends; Miro supports multiple chart types in the same board.
FAQs
How do I create a pie chart in Miro?
Use Charts → Pie, then double-click to enter data and adjust title/legend. Or start from the Pie Chart template for a guided setup. help.miro.com+1
Can I collaborate on pie charts?
Yes—Miro supports real-time co-editing and comments on the same board. https://miro.com/
Can I change slice colours?
Not manually. Colours are assigned automatically by Miro’s Charts. help.miro.com
What can I export?
Export frames/boards as JPG or PDF; text content can be exported as CSV. Availability depends on plan and owner settings. help.miro.com
Is there a marketplace app?
Yes—Miro’s Charts app lists supported types (pie, column, bar, funnel) if you need confirmation. https://miro.com/
Get weekly AI news and advice delivered to your inbox
By subscribing you consent to Generation Digital storing and processing your details in line with our privacy policy. You can read the full policy at gend.co/privacy.


Generation
Digital

UK Office
Generation Digital Ltd
33 Queen St,
London
EC4R 1AP
United Kingdom
Canada Office
Generation Digital Americas Inc
181 Bay St., Suite 1800
Toronto, ON, M5J 2T9
Canada
USA Office
Generation Digital Americas Inc
77 Sands St,
Brooklyn, NY 11201,
United States
EU Office
Generation Digital Software
Elgee Building
Dundalk
A91 X2R3
Ireland
Middle East Office
6994 Alsharq 3890,
An Narjis,
Riyadh 13343,
Saudi Arabia


Company No: 256 9431 77 | Copyright 2026 | Terms and Conditions | Privacy Policy