Measure Digital Transformation: Maximise Your Value (2026)
AI
Free AI at Work Playbook for managers using ChatGPT, Claude and Gemini.
➔ Download the Playbook
Why this matters now
Most organisations are “in transformation” but too few can prove value. Studies still find many programmes fall short of objectives, largely because leaders under-invest in operating model and measurement foundations. Put bluntly: if you can’t measure it at the value-stream level, you won’t scale it.
The most effective digital-transformation KPI stacks mix financial, customer, and flow metrics at the value-stream level. Use DORA for delivery flow, link CX to revenue outcomes, and govern with a single exec scorecard tied to targets and cadence. This closes the gap between “projects shipped” and value realised.
What to measure: a 7-pillar KPI set
Use this menu to assemble a lean scorecard (8–12 KPIs total). Weight by industry and region.
Financial outcomes — revenue growth from digital, gross margin, cost-to-serve, cash conversion, payback period.
Customer value — CX index/NPS/retention/CLV; Forrester shows materially better growth where customer-obsession is high.
Flow & delivery — DORA: deployment frequency, lead time for changes, change failure rate, time to restore. Treat these as leading indicators of value.
Adoption & usage — digital adoption rate, weekly active users, task completion time, feature retention (day-7/day-30).
Quality & reliability — defects escaped, availability/SLO attainment, incident MTTR.
People & ways of working — skills coverage, agile/OKR health, engagement, time on value-adding work.
AI contribution (where relevant) — % decisions AI-assisted, model precision/recall, drift incidents, value attributed to AI per McKinsey’s six-dimension practices (strategy, talent, operating model, tech, data, adoption).
How to build a scorecard executives actually use
Start with value streams, not systems. Pick “Claims”, “Onboarding”, “Checkout”—own the end-to-end economics and customer experience.
Link leading→lagging. Example: DORA lead time (leading) → release quality (intermediate) → NPS/retention and margin (lagging).
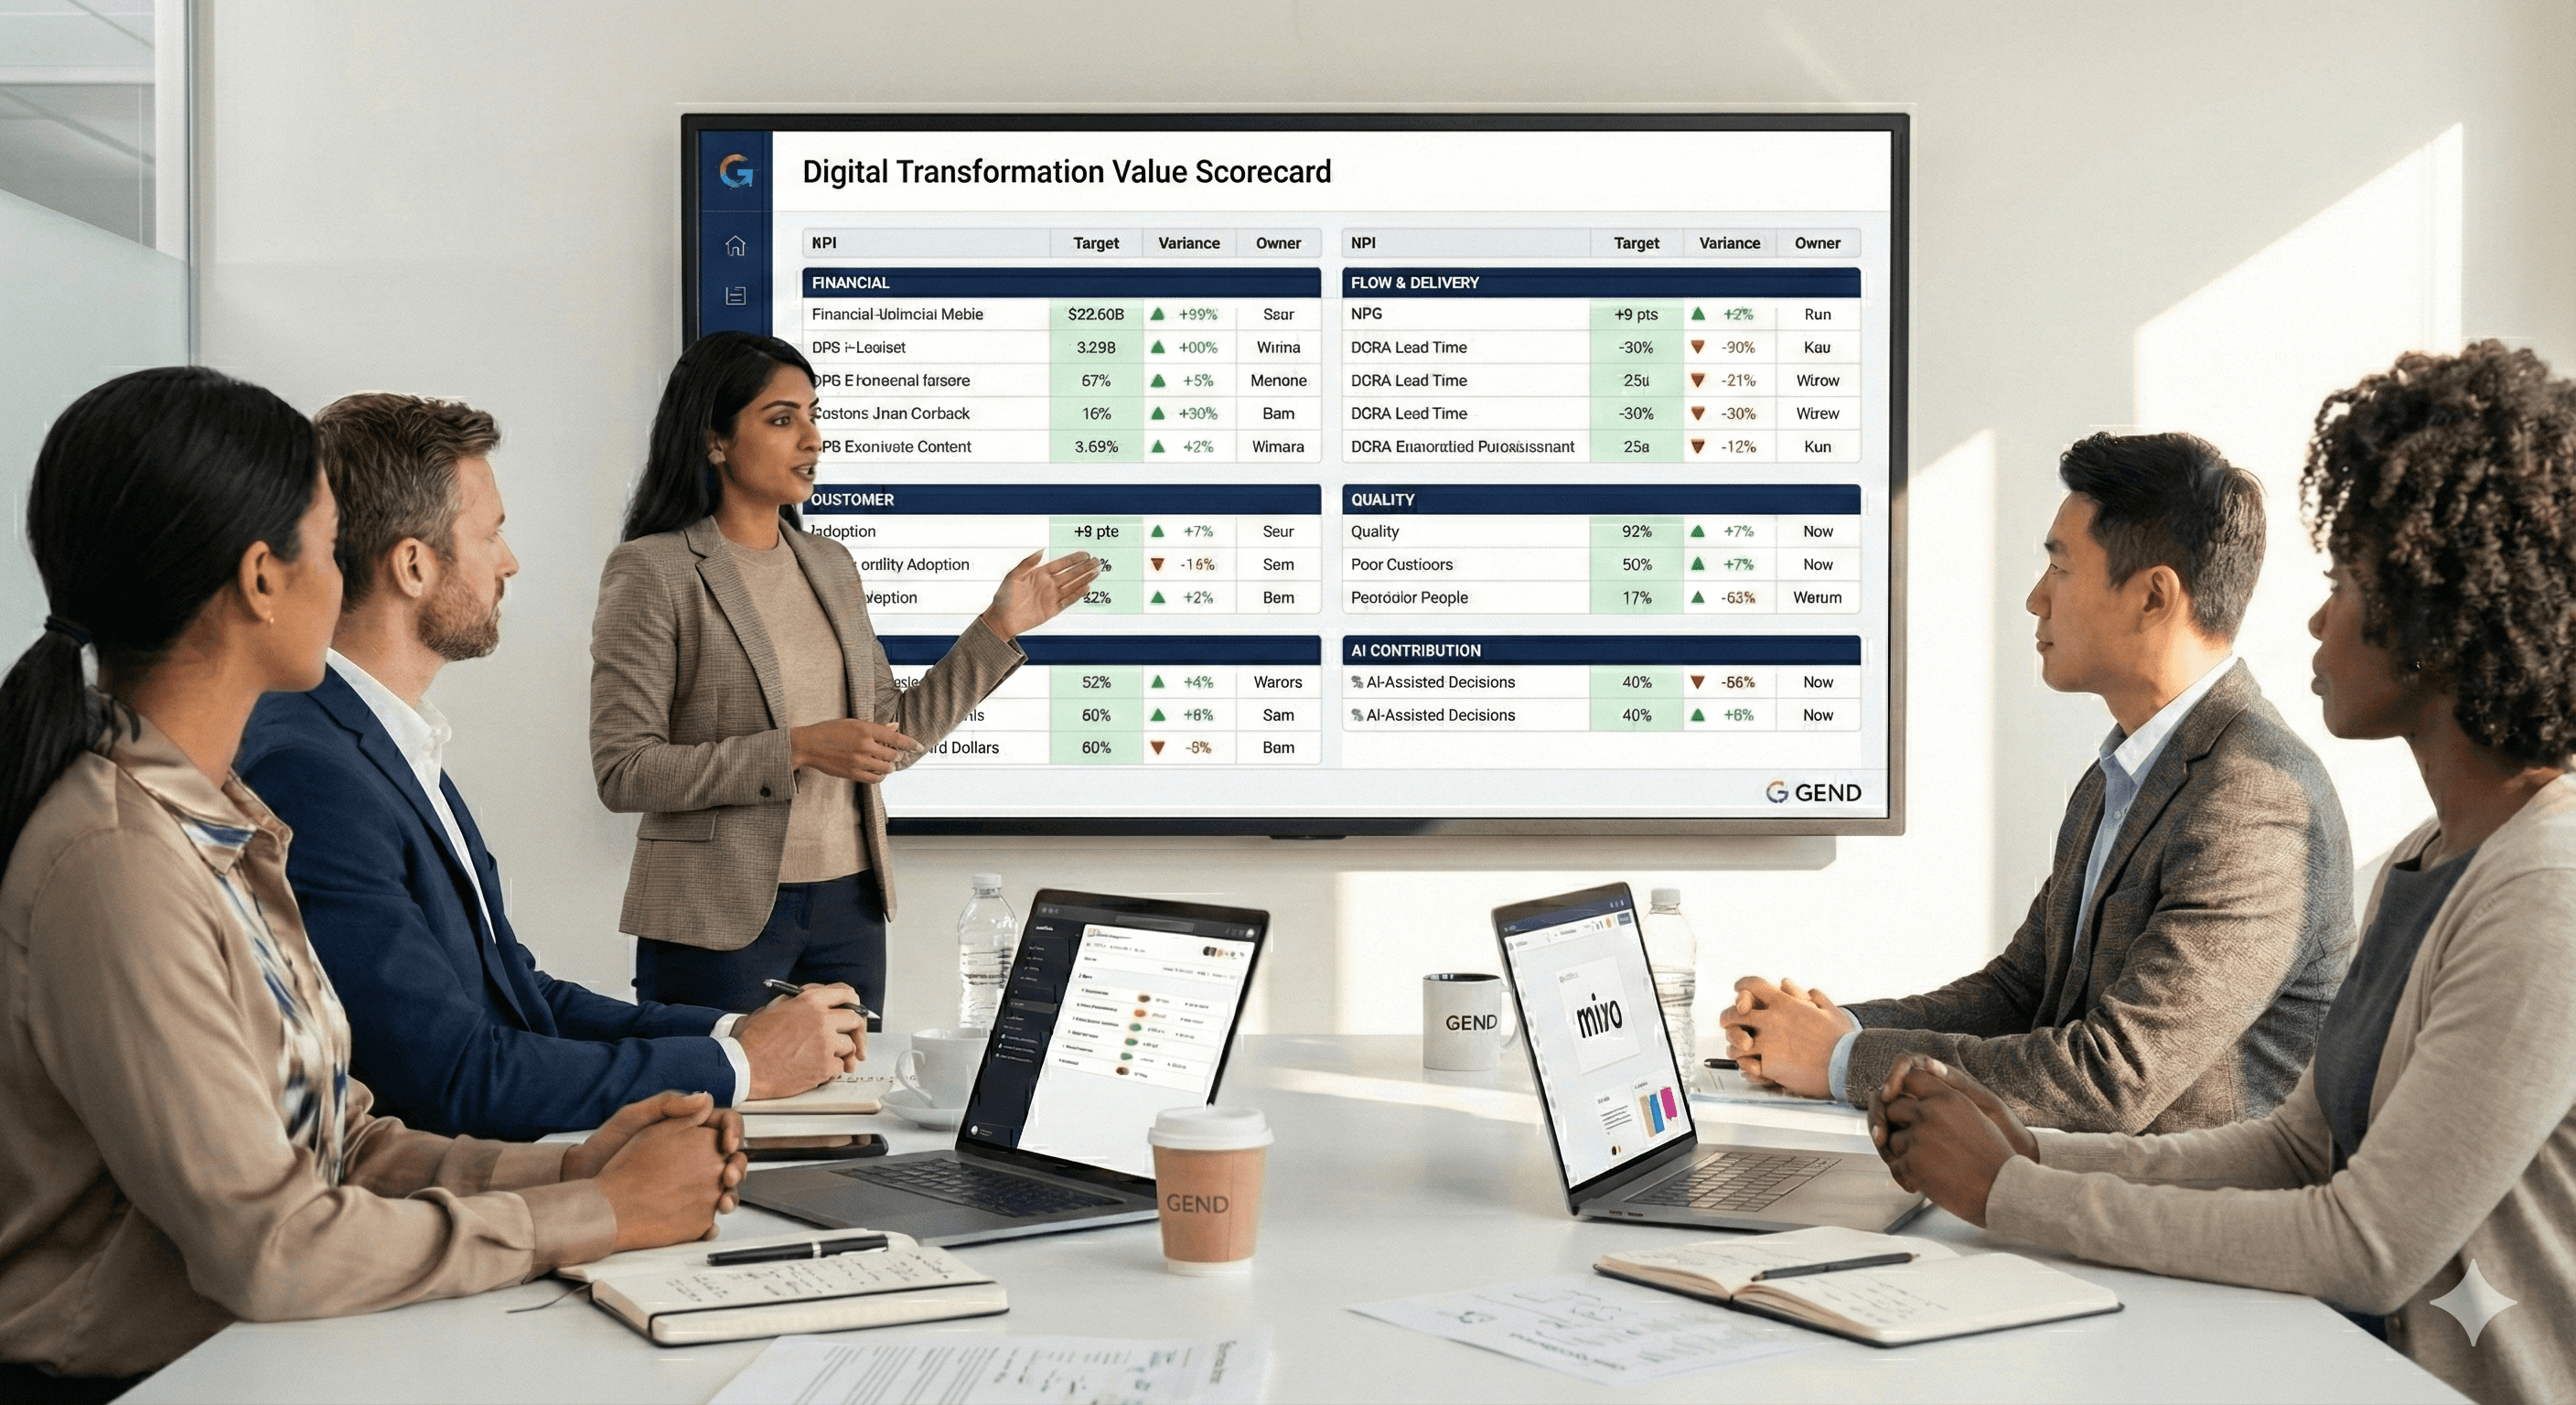
One page, one cadence. A monthly exec scorecard with targets, variance, owners, and next actions; keep tactical dashboards out of the board pack.
Regional nuance. Calibrate CX/NPS baselines by market; ensure data-privacy and localisation KPIs where required (e.g., GDPR compliance metrics in EMEA).
AI realism. Many firms still struggle to convert AI pilots into returns; track AI value explicitly and expect a J-curve before gains materialise.
Example: value-stream scorecard
Pillar | KPI | Target | Owner |
|---|---|---|---|
Customer | NPS (Digital Onboarding) | +8 pts YoY | CX Lead |
Flow | Lead time for change (DORA) | −30% vs Q1 | Eng Director |
Financial | Cost-to-serve per order | −12% YoY | Ops Finance |
Adoption | Digital self-serve completion | 70% of cases | Product |
Quality | Change failure rate (DORA) | <10% | SRE Lead |
AI | % cases triaged by AI with human approval | 40% | Service Ops |
(Swap NPS for satisfaction/loyalty metrics appropriate to your region/industry.)
Playbook: stand up measurement in 30–60 days
Choose two value streams with P&L relevance. Baseline financials, CX, and flow in week 1.
Wire in DORA (if you ship software) with your DevOps toolchain to obtain reliable leading indicators.
Define AI contribution metrics where applicable (e.g., % automated triage, claims auto-adjudication accuracy). Use McKinsey’s six practice areas as your governance checklist.
Publish a one-page scorecard with explicit targets and owners.
Run a monthly “measure-to-improve” ritual: review variance, retire vanity metrics, double-down on the two KPIs that move economics or retention.
What’s new in 2026 (and why your KPIs must evolve)
Flow metrics are mainstream. A decade on, DORA remains the de facto standard for software delivery health; use it to predict customer and financial outcomes.
CX to P&L linkage is clearer. Forrester’s latest work quantifies how improved CX drives faster growth and retention—build this chain of evidence into your board narrative.
AI value concentration. Only a minority of firms report scaled AI returns; measurement discipline separates winners from pilot purgatory.
FAQs
What are digital-transformation KPIs?
They are measures that track value creation across customer, flow, financial, quality, people, and (where relevant) AI—not just IT delivery. Tie them to value streams so they reflect how customers experience your business.
Why aren’t financials enough?
Financials are lagging. You need leading indicators (e.g., DORA flow, adoption, CX) to manage the work that causes the financials to move. Evidence shows better CX and stronger delivery flow correlate with superior outcomes. Forrester
How should KPIs vary by industry/region?
Use the same structure but different weights and thresholds: regulated industries emphasise reliability/compliance; consumer businesses lean into CX/retention; regional norms change NPS and digital-adoption baselines.
How do we measure AI’s contribution?
Track inputs (coverage, latency, human-in-the-loop rate) and outcomes (time saved, accuracy, revenue lift). Govern against McKinsey’s six practice areas to avoid “AI theatre”. McKinsey & Company
Software Solutions
Get weekly AI news and advice delivered to your inbox
By subscribing you consent to Generation Digital storing and processing your details in line with our privacy policy. You can read the full policy at gend.co/privacy.


Generation
Digital

UK Office
Generation Digital Ltd
33 Queen St,
London
EC4R 1AP
United Kingdom
Canada Office
Generation Digital Americas Inc
181 Bay St., Suite 1800
Toronto, ON, M5J 2T9
Canada
USA Office
Generation Digital Americas Inc
77 Sands St,
Brooklyn, NY 11201,
United States
EU Office
Generation Digital Software
Elgee Building
Dundalk
A91 X2R3
Ireland
Middle East Office
6994 Alsharq 3890,
An Narjis,
Riyadh 13343,
Saudi Arabia


Company No: 256 9431 77 | Copyright 2026 | Terms and Conditions | Privacy Policy